
Creating a commercial dashboard is essential to effectively control your activity and optimize your performance.
Without precise monitoring of your key indicators, it is difficult to identify growth levers and adjust your strategy in real time.
Find out how to design a relevant and usable commercial dashboard.
What is a commercial dashboard?
A commercial dashboard is a monitoring and analysis tool that centralizes the main performance indicators linked to number of salescustomers and commercial objectives.
It allows managers and sales teams to make informed decisions, based on updated data.
A good commercial dashboard must be simple, visual and adapted to the specific needs of the company.
What are the 4 commercial performance measurement indicators?
To create a commercial dashboard, you should know which performance indicators you are going to follow. There are a multitude of them, but here are the main ones to follow.
1. turnover and margins
THE turnover reflects the overall performance of sales, while the margin measures the actual profitability of the activity.
Following these indicators makes it possible to identify the most profitable products or services and to adjust the commercial strategy accordingly.
2. Conversion rate
The conversion rate measures the efficiency of commercial actions by comparing the number of prospects to the number of acquired customers.
A low conversion rate may indicate a problem in targeting, commercial discourse or the sales process.
3. Customer acquisition cost (CAC)
The CAC represents the average cost necessary to acquire a new customer.
Optimizing this indicator improves the profitability of marketing and commercial investments.
4. Customer satisfaction and loyalty
A satisfied customer is more inclined to recommend the company and make repeated purchases.
Indicators such as the net promoter score (NPS) or the retention rate make it possible to assess satisfaction and loyalty.
5. The other indicators to follow
If you want to go further, here are other performance indicators to integrate into your commercial dashboard.
- Number of leads generated
- Middle basket
- Reset rate
- Number of commercial opportunities
- Average sales cycle
- Basket abandonment rate
- Customer life value (Customer Lifetime Value – CLV)
- Number of calls or commercial meetings
- Quotation transformation rate
- Average response time to prospects
- Churn rate (customer attrition)
- Cost by lead (CPL)
- Market share
- Customer satisfaction (CSAT)
- Net promoter score (NPS)
- Back on investment (King) of commercial actions
- Commitment to marketing campaigns
- Number of recommendations or sponsorships
- Emailing campaigns response rate
- Average payment period of customers
The important thing is to select the KPIS that best match your activity.
How to develop a 4 -step commercial dashboard?
Here are the steps to make your commercial dashboard.
1. Define key objectives and indicators
Before creating a dashboard, it is essential to clarify your commercial objectives or your Sales objectives : increase in turnover, improvement of the conversion rate, reduction in customer acquisition cost, etc.
Choose the relevant indicators based on these objectives to avoid overloading unnecessary information.
2. Collect and structure the data
The data must be reliable and regularly updated. Identify the relevant sources: CRM, billing softwareGoogle Analytics, etc.
Organize this data structured to facilitate analysis and visualization.
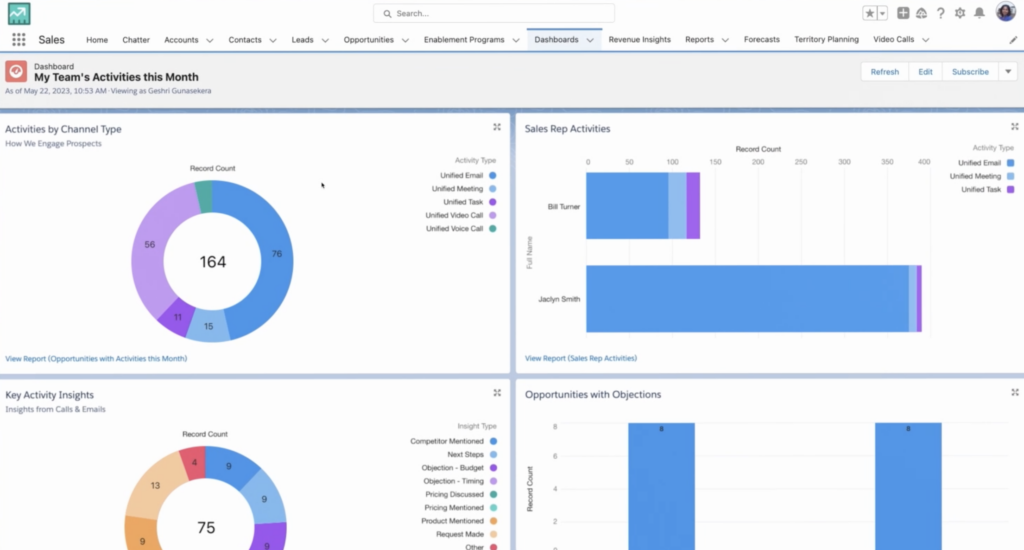
3. Design a clear and relevant visualization
A good dashboard must be readable at a glance. Use graphics, tables and visual indicators to facilitate interpretation.
Favor a simple and refined layout, with coherent colors and visual codes.
4. Analyze and adjust regularly
A commercial dashboard is not frozen: it must be updated and optimized according to the results obtained.
Regularly analyze performance, adjust your indicators if necessary and adapt your strategies accordingly.
With which tools to create a commercial dashboard?
There are different approaches to create a commercial dashboard. It depends on the size of your business, number of salespeople and your growth goals.
Also remember to automate reporting, with a Marketing Automation platform For example, so that all your teams regularly receive the commercial dashboard.
1. Sounds: a simple and flexible solution
To start, follow -up using spreadsheets can allow you to create a commercial dashboard quickly and at a lower cost.
Google Sheets
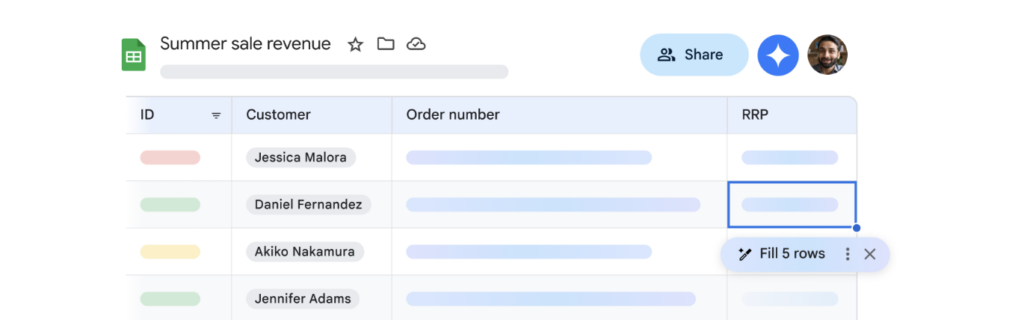
Google Sheets Offers the same features as Excel with the advantage of online collaborative work, allowing real -time update.
Excel
Microsoft Excel is one of the most used tools to create commercial dashboards thanks to its dynamic formulas, graphics and tables.
Airable
Airable Combs the simplicity of a spreadsheet with the advanced features of a database, ideal for structuring and visualizing commercial data.
2. Business Intelligence (BI) tools: advanced analyzes
BI tools are suitable for large companies that require advanced reports or more complex data crossings. In particular, they allow you to connect to your CRM or to your ERP To extract all the relevant data to integrate into your commercial dashboard.
Power Bi

Developed by Microsoft, Power Bi Allows you to create interactive and dynamic dashboards by integrating data from multiple sources.
Painting
Painting is a powerful BI solution that facilitates the analysis and visualization of commercial performance through dynamic graphics and tables.
Google Looker Studio
Free and intuitive, Google Studio look Allows to connect different data sources and generate interactive and visual reports.
3. CRM and commercial management software: automated monitoring
Commercial monitoring integrated in most large CRM Allows you to have a commercial dashboard which is enough most of the time in very small businesses / SMEs.
Dirty
Dirty is a complete CRM that incorporates advanced analysis tools to follow commercial performance and automate reporting.
Hubspot
Hubspot offers a Free CRM With customizable dashboards to follow sales, customer interactions and marketing performance.
Pipedrive
Pipedrive is an intuitive CRM designed for sales teams, offering clear visualization of the sales pipeline and performance.
How to improve a commercial dashboard?
The little extra is to decline an individual dashboard by salesperson.
Without entering into the competition between salespeople, this can identify the strengths and weaknesses of each of your employees and improve their individual performance.
The commercial dashboard at the individual level can be available only by management so as not to create harmful competition between salespeople or on the contrary, be public to stimulate your teams.
Create your commercial dashboard
The important thing is to start collecting and tracking data. Do not hesitate to adjust over the months if you realize that you lack information or that some are useless.
Do not hesitate to define your “North Star Metric”To make your whole sales team aligned with the same objectives.
And if you need to go faster in achieving your commercial goals, why not call on a Freelance commercial To strengthen your teams?