Data isn’t just a report card. It’s your performance marketing roadmap. Following that roadmap means moving beyond Google Analytics 4’s default tools.
If you rely only on built-in GA4 reports, you’re stuck juggling interfaces and struggling to tell a clear story to stakeholders.
This is where Looker Studio becomes invaluable. It allows you to transform raw GA4 and advertising data into interactive dashboards that deliver decision-grade insights and drive real campaign improvements.
Here’s how GA4 and Looker Studio work together for PPC reporting. We’ll compare their roles, highlight recent updates, and walk through specific use cases, from budget pacing visualizations to waste-reduction audits.
GA4 vs. Looker Studio: How they differ for PPC reporting
GA 4 is your source of truth for website and app interactions. It tracks user behavior, clicks, page views, and conversions with a flexible, event-based model. It even integrates with Google Ads to pull key ad metrics into its Advertising workspace. However, GA4 is primarily designed for data collection and analysis, not polished, client-facing reporting.
Looker Studio, on the other hand, serves as your one-stop shop for reporting. It connects to more than 800 data sources, allowing you to build interactive dashboards that bring everything together.
Here’s how they compare functionally in 2026.
Data sources
GA4 focuses on on-site analytics. In late 2025, Google finally rolled out native integration for Meta and TikTok, allowing automatic import of cost, clicks, and impressions without third-party tools.
However, the feature is still rigid. It requires strict UTM matching and lacks the ability to clean campaign names or import platform-specific conversion values, such as Facebook Leads vs. GA4 Conversions.
Looker Studio excels here, allowing you to blend these data sources more flexibly or connect to platforms GA4 still doesn’t support natively, such as LinkedIn or Microsoft Ads.
Metrics and calculations
GA4’s reporting UI has improved significantly, now allowing up to 50 custom metrics per standard property, up from the previous limit of five. However, these are often static.
Looker Studio allows calculated fields, meaning you can perform calculations on your data in real time, such as calculating profit by subtracting cost from revenue, without altering the source data.
Data blending
Looker Studio lets you blend multiple data sources, essentially joining tables, to create richer insights. While enterprise users on Looker Studio Pro can now use LookML models for robust data governance, the standard free version still offers flexible data blending capabilities to match ad spend with downstream conversions.
Sharing and collaboration
Sharing insights in GA4 often means granting property access or exporting static files. Looker Studio reports are live web links that update automatically. You can also schedule automatic email delivery of PDF reports for free.
Enterprise features in Looker Studio Pro add options for delivery to Google Chat or Slack, but standard email scheduling is available to everyone.
Dig deeper: How to use GA4 predictive metrics for smarter PPC targeting
Your customers search everywhere. Make sure your brand shows up.
The SEO toolkit you know, plus the AI visibility data you need.
Start Free Trial
Get started with

Why you need Looker Studio
Here’s where Looker Studio moves from helpful to essential for PPC teams.
1. Unified, cross-channel view of PPC performance
You don’t rely on just one ad platform. A Looker Studio dashboard becomes your single source of truth, pulling in intent-based Google Ads data and blending it with awareness-based Meta and Instagram Ads for a holistic view.
Instead of just comparing clicks, use Looker Studio to normalize your data. For instance, you might discover that X Ads drove 17.9% of users, while Microsoft Ads drove 16.1%, allowing you to allocate budget based on actual blended performance.
2. Visualizing creative performance
In industries like real estate, the image sells the click. A spreadsheet saying “Ad_Group_B performed well” means nothing to a client.
Use the IMAGE function in Looker Studio. If you use a connector that pulls the Ad Image URL, you can display the actual photo of that luxury condo or HVAC promotion directly in the report table alongside the CTR. This lets clients see exactly which creative is driving results, without translation.
3. Deeper insight into post-click behavior
Reporting shouldn’t stop at the click. By bringing GA4 data into your Looker Studio report, you connect the ad to the subsequent action.
You might discover that a Cheap Furnace Repair campaign has a high CTR but a 100% bounce rate. Looker Studio lets you visualize engaged sessions per click alongside ad spend, proving lead quality matters more than volume.
4. Custom metrics for business goals
Every business has unique KPIs. A real estate company might track tour-to-close ratio, while an HVAC company focuses on seasonal efficiency.
Looker Studio lets you build these formulas once and have them update automatically. You can even bridge data gaps to calculate return on ad spend (ROAS) by creating a formula that divides your CRM revenue by your Google Ads cost.
5. Storytelling and narrative
Raw data needs context. Looker Studio allows you to add text boxes, dynamic date ranges, and annotations that turn numbers into narratives.
Use annotations to explain spikes or drops. Highlight the so what behind the metrics. If cost per lead spiked in July, add a text note directly on the chart, “Seasonal demand surge + competitor aggression.” This preempts client questions and transforms a static report into a strategic tool.
Dig deeper: How to leverage Google Analytics 4 and Google Ads for better audience targeting
Get the newsletter search marketers rely on.
Use cases: PPC dashboards that drive real insights
These dashboards go beyond surface metrics and surface insights you can act on immediately.
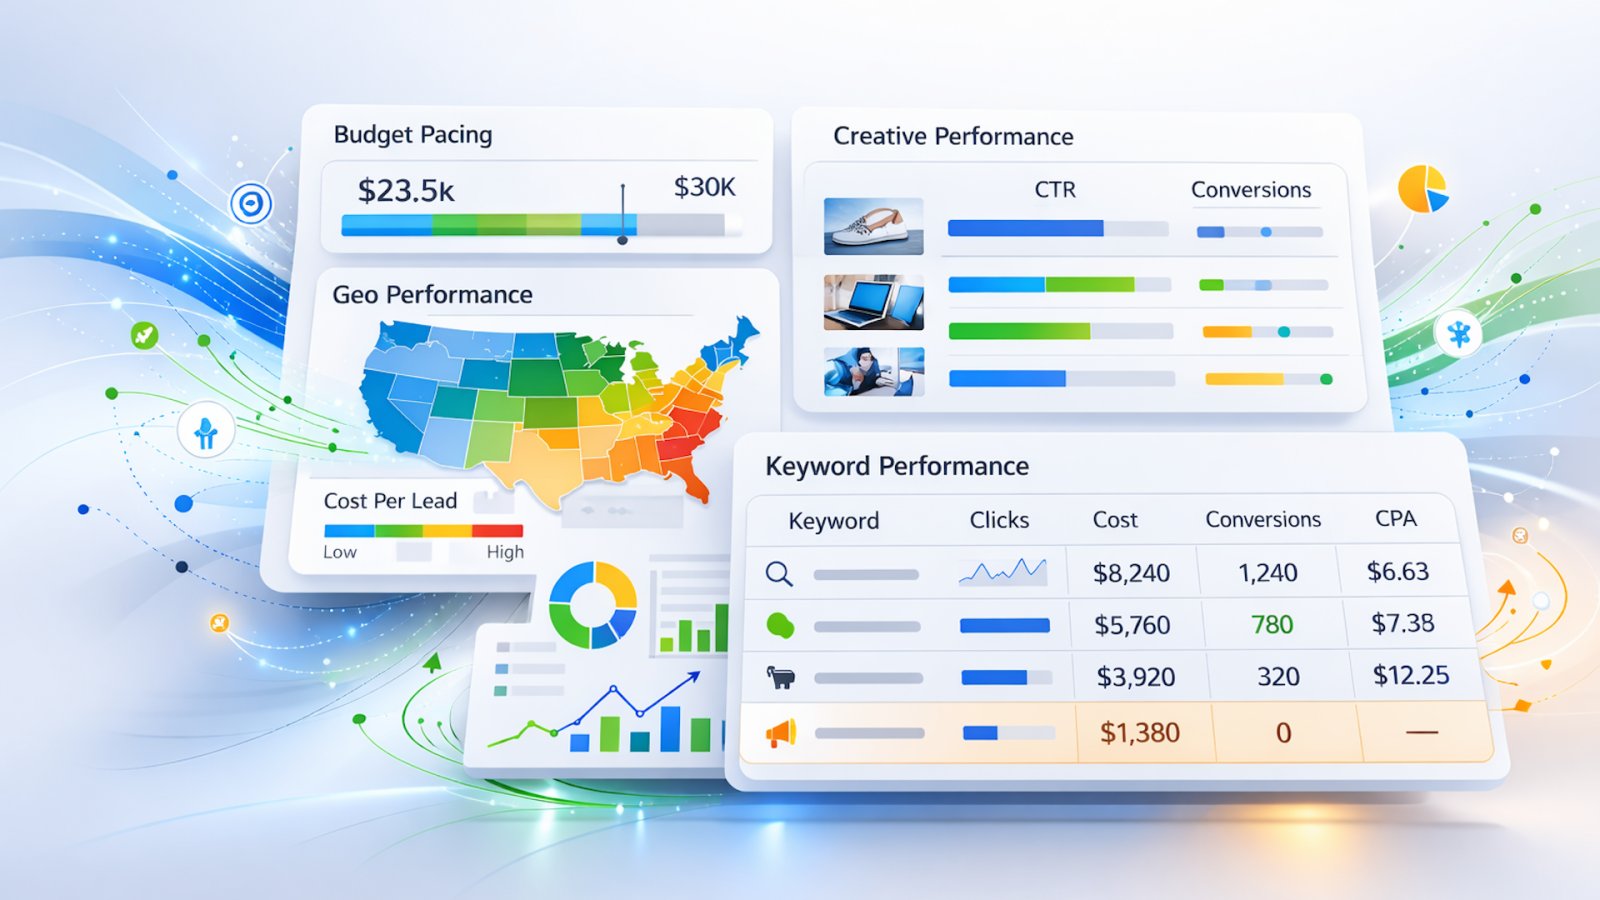
The budget pacing dashboard
Anxious about overspending? Standard reports show what you’ve spent, but not how it relates to your monthly cap.
Use bullet charts in Looker Studio. Set your target to the linear spend for the current day of the month. For example, if you’re 50% through the month, the target line is 50% of the budget.
This visual instantly shows stakeholders whether you’re overpacing and need to pull back, or underpacing and need to push harder, ensuring the month ends on budget.
The zero-click audit report
High spend with zero conversions is the silent budget killer in service industries.
Create a dedicated table filtered for waste. Set it to show only keywords where conversions = 0 and cost > $50, or whatever threshold makes sense for you, sorted by cost in descending order.
This creates an immediate hit list of keywords to pause. Showing this to a client proves you’re actively managing their budget and cutting waste, or you can use it internally.
Geographic performance maps
For local services, location is everything. GA4 provides location reports, but Looker Studio visualizes them in ways that matter.
Build a geo performance page that shades regions by cost per lead rather than traffic volume.
You might find that while City A drives the most traffic, City B generates leads at half the cost. This allows you to adjust bid modifiers by ZIP code or city to maximize ROI.
Dig deeper: 5 things your Google Looker Studio PPC Dashboard must have
Getting the most out of GA4 and Looker Studio in 2026
To ensure success with this combination, keep these final tips in mind.
Watch your API quotas
One of today’s biggest technical challenges is GA4 API quotas. If your dashboard has too many widgets or gets viewed by too many people at once, charts may break or fail to load.
If you have heavy reporting needs, consider extracting your GA4 data to Google BigQuery first, then connecting Looker Studio to BigQuery. This bypasses API limits and significantly speeds up your reports.
Enable optional metrics
Different clients have different needs. In your charts, enable the “optional metrics” feature. This adds a toggle that lets viewers swap metrics, for example, changing a chart from clicks to impressions, without editing the report each time.
Validate and iterate
When you first build a report, spot-check the numbers against the native GA4 interface. Make sure your attribution settings are correct.
Once you’ve established trust in the data, treat the dashboard as a living product, and keep iterating on the design based on what your stakeholders actually use and need.
See the complete picture of your search visibility.
Track, optimize, and win in Google and AI search from one platform.
Start Free Trial
Get started with
From reactive reporting to proactive PPC strategy
Master Looker Studio to unlock GA4’s full potential for PPC reporting. GA4 gives you granular behavioral metrics; Looker Studio is where you combine, refine, and present them.
Move beyond basic metrics and use advanced visualizations — budget pacing, bullet charts, and ad creative tables — to deliver the transparency that builds real trust.
The result? You’ll shift from reactive reporting to proactive strategy, ensuring you’re always one step ahead in the data-driven landscape of 2026.
Dig deeper: Why click-based attribution shouldn’t anchor executive dashboards
Contributing authors are invited to create content for Search Engine Land and are chosen for their expertise and contribution to the search community. Our contributors work under the oversight of the editorial staff and contributions are checked for quality and relevance to our readers. Search Engine Land is owned by Semrush. Contributor was not asked to make any direct or indirect mentions of Semrush. The opinions they express are their own.